librosa python3.10
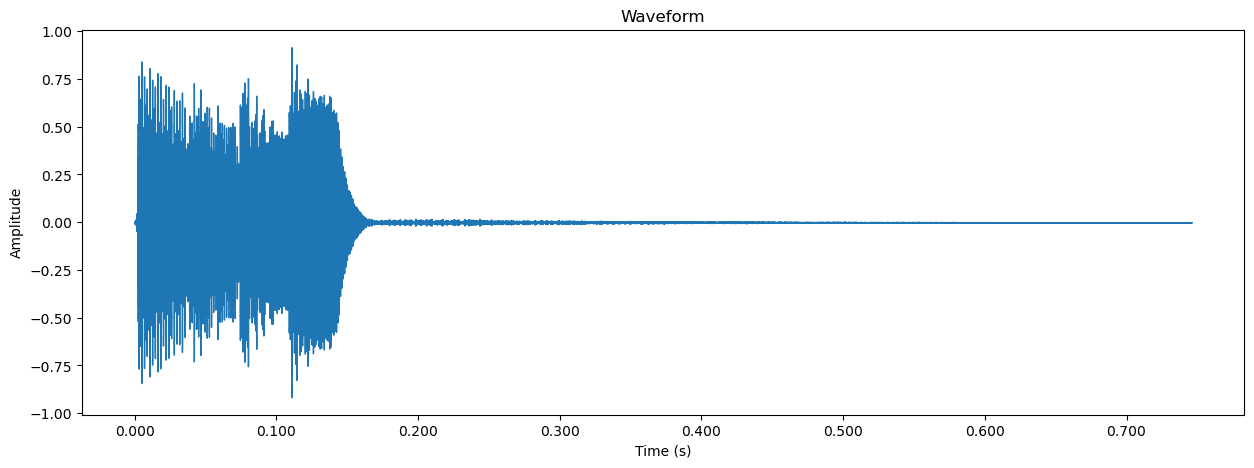
音声ファイルを波形表示
import librosa
import librosa.display
import matplotlib.pyplot as plt

# 音声ファイルの読み込み
y, sr = librosa.load('/Users/haru/Downloads/maou_se_system49.wav')

# 波形の描画
plt.figure(figsize=(15, 5))
librosa.display.waveshow(y, sr=sr)
plt.title('Waveform')
plt.xlabel('Time (s)')
plt.ylabel('Amplitude')
plt.show()
sounddevice python3.55
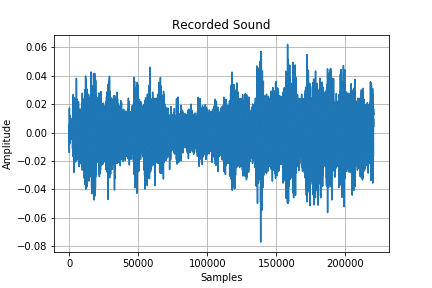
音声を録音して波形表示
#音声を録音し、matplotlibで波形表示する

import sounddevice as sd
import matplotlib.pyplot as plt

# Set up the recording parameters
duration = 5  # seconds
fs = 44100  # sampling rate(Hzで表されるサンプルレートは数値が高ければ高いほど音が滑らかになる)
channels = 1  # mono

# Record the sound
print("Recording...")
myrecording = sd.rec(int(duration * fs), samplerate=fs, channels=channels)
sd.wait()  # Wait until recording is finished

# Plot the waveform
plt.plot(myrecording)
plt.xlabel("Samples")
plt.ylabel("Amplitude")
plt.title("Recorded Sound")
plt.grid()

# Save the waveform as a PNG file
plt.savefig("/Users/haru/Desktop/recorded_sound.png")

plt.show()
pyaudio
音声をリアルタイムで波形表示
#音声を継続的に録音しながらリアルタイムで波形表示

import pyaudio
import numpy as np
import matplotlib.pyplot as plt

# Set up PyAudio
CHUNKSIZE = 4096
RATE = 44100
p = pyaudio.PyAudio()
stream = p.open(format=pyaudio.paInt16, channels=1, rate=RATE, input=True, frames_per_buffer=CHUNKSIZE)

# Set up matplotlib
plt.ion()
fig, ax = plt.subplots()
x = np.arange(0, 2*CHUNKSIZE, 2)
line, = ax.plot(x, np.random.rand(CHUNKSIZE), '-', lw=2)

# Continuously plot the wave in real-time
while True:
    data = stream.read(CHUNKSIZE)
    data = np.frombuffer(data, dtype=np.int16)
    line.set_ydata(data)
    fig.canvas.draw()
    fig.canvas.flush_events()

# Clean up
stream.stop_stream()
stream.close()
p.terminate()

